|
|
Maximum
slider position (mm) |
Minimum
slider position (mm) |
|
Theoretical
result |
129.82 |
10.18 |
|
Experimental
result |
129 |
10 |
In conclusion, the experiment is successfully done since
the experimental results tend to agree to the theoretical aspects of the
experiment. It has been proven and
verified that the Crank and Slotted Lever mechanism does have a quick return
stroke and a slow cutting or forward stroke with an increase in efficiency of
the machine tool.
The main purpose of this experiment is to investigate the kinematic motion of a Crank and Slotted Lever Quick Return Mechanism. The investigation is to show that it is indeed a quick return mechanism and then the evaluation of the increase in efficiency that the system may offer if it is applies to a machine tool will be done.
Apparatus
Crank and Slotted Lever Quick Return Mechanism
Procedures
1. The crank is set to zero so that the pointer at the scale begins at the initial position.
2. The position of the crosshead, x is recorded.
3. The crank is rotated by 10° increment and again the x value will be recorded in the table.
4. Steps above were repeated until one complete revolution of the crank.
Data, Observation and Calculation of Results
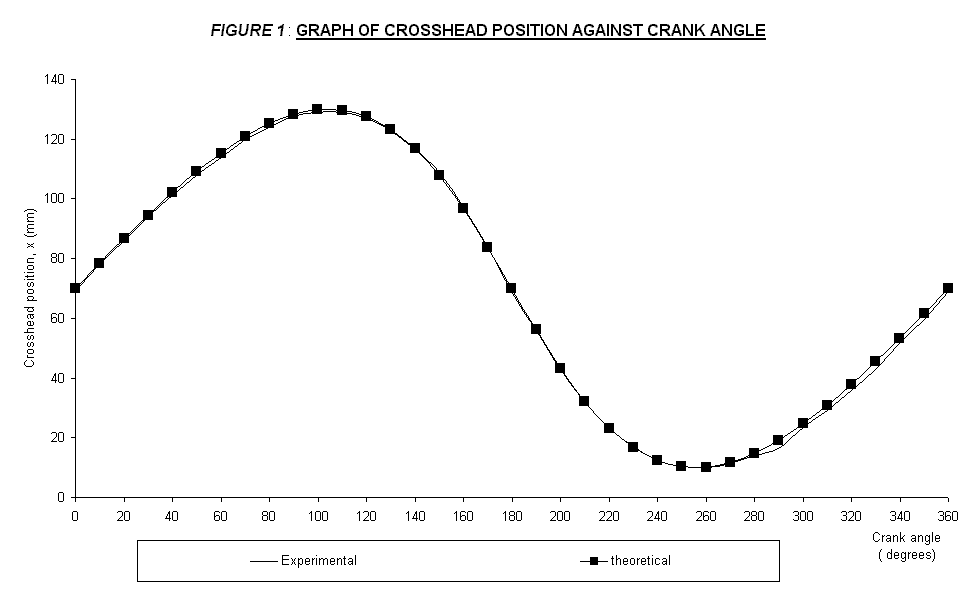
Table 1 below shows the experimental and theoretical results. From the data recorded, the graph of measured and theoretical crosshead position against crank angle was plotted in FIGURE 1, attached in the Appendix. From the plotted graph, the return and cutting strokes range was shown. The calculation of the theoretical values is shown in the Appendix.
|
Crank
angle |
Theoretical
Slider Position, x |
Experimental
Slider Position, x |
|
(degrees) |
(mm) |
(mm) |
|
0 |
70.00 |
69 |
|
10 |
78.36 |
78 |
|
20 |
86.58 |
86 |
|
30 |
94.53 |
94 |
|
40 |
102.08 |
101 |
|
50 |
109.07 |
108 |
|
60 |
115.36 |
114 |
|
70 |
120.77 |
120 |
|
80 |
125.12 |
124 |
|
90 |
128.21 |
127.5 |
|
100 |
129.82 |
129 |
|
110 |
129.71 |
129 |
|
120 |
127.65 |
127 |
|
130 |
123.39 |
123 |
|
140 |
116.79 |
116.5 |
|
150 |
107.81 |
109 |
|
160 |
96.66 |
97 |
|
170 |
83.80 |
84 |
|
180 |
70.00 |
69 |
|
190 |
56.20 |
56 |
|
200 |
43.34 |
43 |
|
210 |
32.19 |
32 |
|
220 |
23.21 |
23 |
|
230 |
16.61 |
17 |
|
240 |
12.35 |
12.5 |
|
250 |
10.29 |
10.5 |
|
260 |
10.18 |
10 |
|
270 |
11.79 |
11.5 |
|
280 |
14.88 |
14 |
|
290 |
19.23 |
16.5 |
|
300 |
24.64 |
23.5 |
|
310 |
30.93 |
29 |
|
320 |
37.92 |
36 |
|
330 |
45.47 |
43 |
|
340 |
53.42 |
51.5 |
|
350 |
61.64 |
59.5 |
|
360 |
70.00 |
69 |
Table
1
From the experimental data tabulated in Table 1 and the plotted graph, the maximum experimental slider position, x is 129 mm, occurs between 100° and 110°. The minimum slider position, at 10 mm, occurs at 260°. With reference to the plotted graph, by considering the minimum and maximum slider position point and assuming that the mechanism is rotating at a constant speed, it can be said that the return stroke occupies about 160° (from 100° to 260°), which is about 44.44% from the full revolution. The cutting stroke occupies about 200° (from 0° to 100° and again from 260° to 360°), which is about 55.56% from the full revolution. So, it can be said that the return stroke takes less percentage of crank revolution compared to the cutting stroke. Thus, the return stroke requires less energy to operate and less time taken compared to the cutting stroke.
The possible maximum increase in efficiency is calculated. It is about 11.12%. With reference to FIGURE 1, it can be said that the shape of the experimental results has the same shape to the theory of this experiment, which are slow cutting stroke and a fast return stroke. Therefore, the experimental result tends to agree to the predictions from the theory of the experiment. The graph shows that the slope in the return stroke region is steeper than the slope in the forward cutting stroke. The cutting stroke takes higher percentage crank revolution so it can be assume that it requires more power and work to operate it compared to the return stroke due to the mechanism of the quick return motion.
The
result of the experiment shows a small deviation compared to the theoretical
value with an average percentage error for about 2.1 %. The
difference between the theoretical and the experimental results may caused by
parallax error occur when the readings was taken and also during setting the
pointer at the specific angle, where the pointer is not accurately set to the
intended angle. All the calculation involving the theoretical and error
values were shown at the Appendix section.
Although error exist, but it does not effect in terms of confirming that
the crank and slotted lever has a quick return mechanism that may increase the
efficiency if it is applied to a machine tool.
Table 2 below shows the percentage error value at each crank angle.
|
Crank
angle |
Theoretical
position, x |
Experimental
position, x |
Error
|
|
(degrees) |
(mm) |
(mm) |
(%) |
|
0 |
70.00 |
69 |
1.4 |
|
10 |
78.36 |
78 |
0.5 |
|
20 |
86.58 |
86 |
0.7 |
|
30 |
94.53 |
94 |
0.6 |
|
40 |
102.08 |
101 |
1.1 |
|
50 |
109.07 |
108 |
1.0 |
|
60 |
115.36 |
114 |
1.2 |
|
70 |
120.77 |
120 |
0.6 |
|
80 |
125.12 |
124 |
0.9 |
|
90 |
128.21 |
127.5 |
0.6 |
|
100 |
129.82 |
129 |
0.6 |
|
110 |
129.71 |
129 |
0.5 |
|
120 |
127.65 |
127 |
0.5 |
|
130 |
123.39 |
123 |
0.3 |
|
140 |
116.79 |
116.5 |
0.2 |
|
150 |
107.81 |
109 |
1.1 |
|
160 |
96.66 |
97 |
0.4 |
|
170 |
83.80 |
84 |
0.2 |
|
180 |
70.00 |
69 |
1.4 |
|
190 |
56.20 |
56 |
0.4 |
|
200 |
43.34 |
43 |
0.8 |
|
210 |
32.19 |
32 |
0.6 |
|
220 |
23.21 |
23 |
0.9 |
|
230 |
16.61 |
17 |
2.3 |
|
240 |
12.35 |
12.5 |
1.2 |
|
250 |
10.29 |
10.5 |
2.0 |
|
260 |
10.18 |
10 |
1.8 |
|
270 |
11.79 |
11.5 |
2.5 |
|
280 |
14.88 |
14 |
5.9 |
|
290 |
19.23 |
16.5 |
14.2 |
|
300 |
24.64 |
23.5 |
4.6 |
|
310 |
30.93 |
29 |
6.2 |
|
320 |
37.92 |
36 |
5.1 |
|
330 |
45.47 |
43 |
5.4 |
|
340 |
53.42 |
51.5 |
3.6 |
|
350 |
61.64 |
59.5 |
3.5 |
|
360 |
70.00 |
69 |
1.4 |
Table
2
Average percentage error = 2.1 %
Conclusion
Appendix
A.
Inversion of the slider-crank chain
![]()

![]()
![]()

![]()
![]()
![]()
![]()
![]()

![]()
![]()
![]() C
240 mm
C
240 mm

![]()

![]()
![]()
![]()
![]()
![]()
![]()
![]()
![]()
![]() FIGURE
2: Known dimensions of the crank and quick return mechanism
FIGURE
2: Known dimensions of the crank and quick return mechanism
Initially, the slider position is at 70mm when the crank angle, q is zero and 180 degrees. The known values are the crank radius, OB is 40mm. The slotted lever length, AC is 240mm and the distance OA is 160mm.
v In order to determine the theoretical values of the slider position, basic trigonometry must be applied. The governing theoretical equation is shown below.
Y = 40 sin q
X1 = 40 cos q
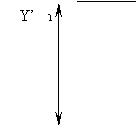
Y’ = 240 sin a
In order to find Y’, a must be determine first.
![]()
From trigonometry, a
= tan-1 (
Y )
160 + X1
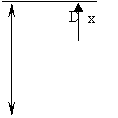
\ Theoretical slider position, X = 70 + Y’
v Percentage of the crank revolution occupied by each stroke
= angle occupied * 100
360
v Increase in efficiency, h
= % of crank revolution in cutting stroke - % of crank revolution in return stroke
v Percentage error = (x theoretical – x experimental ) * 100
x experimental
v Theoretical slider position:
Y = 40 sin q = 40 sin 10° = 6.9459
X1 = 40 cos q = 40 cos 10° = 39.3923
Y’ = 240 sin a
In order to find Y’, a must be determine first.
![]()
From trigonometry, a
= tan-1 (
Y )
= tan–1 [6.9459 / (160+39.3923)] = 1.9951°
160 + X1
\ Y’ = 240 sin a = 240 sin 1.9951° = 8.3354 mm
\ Theoretical slider position, X = 70 + Y’ = 70+8.3354 = 78.3554 =78.36 mm
v Percentage of the crank revolution occupied by each stroke
= angle occupied * 100
360
- Rotation angle for return stroke = 160 degrees
\For cutting stroke: (200 / 360) x 100 = 55.56 % from one full revolution
\For return stroke: (160 / 360) x 100 = 44.44 % from one full revolution
v Increase in efficiency, h
= % of crank revolution in cutting stroke - % of crank revolution in return stroke
Therefore, the efficiency is given by:
Efficiency, h = 55.56 % - 44.44 % = 11.12 %
v Percentage error = (x theoretical – x experimental ) * 100
x theoretical
= (78.36 – 70) *100 = 0.5 %
78.36
v Average percentage error = sum of all % error = 2.1%
37
