 |
Course Number: MEMB 321
Day and Date experiment performed : 2000
Due Date: 2000
Lecturer : ****
Statement of
Purpose/ Objective:
The objective of the experiment is to: -
∑ Determine the coefficient of friction between steel and the belt ( Vee and Flat)
Data,
Observation and Results:
Belt
and friction experiment for vee belt
For the 30o
|
T1 |
T2 |
m |
|
50 |
40 |
0.146 |
|
60 |
50 |
0.119 |
|
70 |
52 |
0.195 |
|
80 |
65 |
0.136 |
|
90 |
73 |
0.137 |
Average m from table :0.1466
Slope of linear line: 10
For the 60o
|
T1 |
T2 |
m |
|
60 |
35 |
0.176 |
|
80 |
52 |
0.141 |
|
90 |
58 |
0.143 |
|
100 |
65 |
0.141 |
|
110 |
74 |
0.129 |
Average m from table :0.146
Slope of linear line: 13
For the 90o
|
T1 |
T2 |
m |
|
90 |
60 |
0.088 |
|
100 |
65 |
0.094 |
|
110 |
78 |
0.075 |
|
120 |
88 |
0.068 |
|
130 |
95 |
0.068 |
Average m from table :0.0786
Slope of linear line: 10
For the 120o
|
T1 |
T2 |
m |
|
50 |
20 |
0.150 |
|
60 |
26 |
0.137 |
|
70 |
34 |
0.118 |
|
80 |
44 |
0.098 |
|
90 |
53 |
0.086 |
Average m from table :0.1178
Slope of linear line: 10
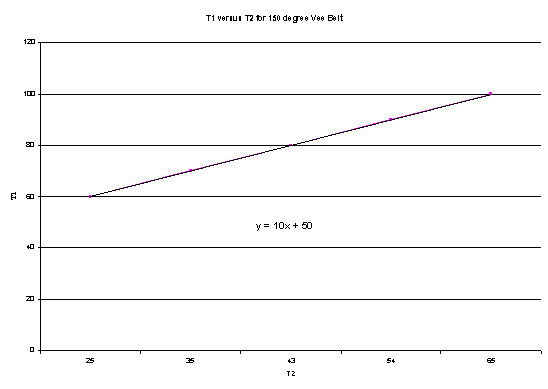
For the 150o
|
T1 |
T2 |
m |
|
60 |
25 |
0.114 |
|
70 |
35 |
0.091 |
|
80 |
43 |
0.081 |
|
90 |
54 |
0.067 |
|
100 |
65 |
0.056 |
Average m from table :0.0818
Slope of linear line: 10
For the 30o
|
T1 |
T2 |
m |
|
50 |
49 |
0.039 |
|
60 |
60 |
0 |
|
70 |
65 |
0.142 |
|
75 |
72 |
0.078 |
|
|
|
|
Average m from table :0.06475
Slope of linear line: 8.5
For the 60o
|
T1 |
T2 |
m |
|
40 |
27 |
0.375 |
|
50 |
35 |
0.341 |
|
60 |
45 |
0.275 |
|
70 |
58 |
0.180 |
|
80 |
65 |
0.198 |
Average m from table :0.2738
Slope of linear line: 10
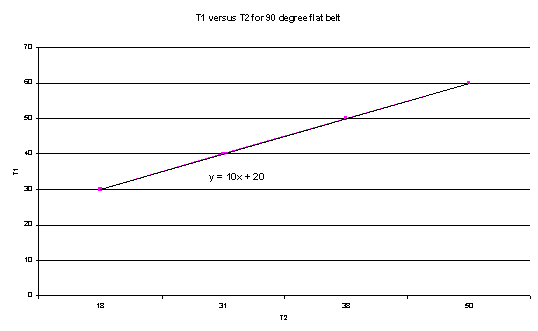
For the 90o
|
T1 |
T2 |
m |
|
30 |
18 |
0.325 |
|
40 |
31 |
0.162 |
|
50 |
38 |
0.175 |
|
60 |
50 |
0.116 |
|
70 |
59 |
0.109 |
Average m from table :0.1774
Slope of linear line: 10
For the 120o
|
T1 |
T2 |
m |
|
20 |
13 |
0.206 |
|
30 |
22 |
0.148 |
|
40 |
31 |
0.122 |
|
50 |
39 |
0.119 |
|
60 |
49 |
0.097 |
Average m from table :0.1384
Slope of linear line:10
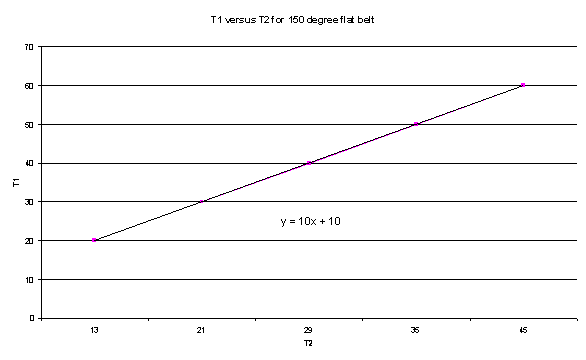
For the 150o
|
T1 |
T2 |
m |
|
20 |
13 |
0.165 |
|
30 |
21 |
0.136 |
|
40 |
29 |
0.123 |
|
50 |
35 |
0.136 |
|
60 |
45 |
0.120 |
Average m from table :0.1088
Slope of linear line: 10
Sample
calculation:
Flat belt:
T1=50 T2=49
a=90o
u = 30o=0.523599 radian
T1/T2= emu/sin a
Where T1-initial tension on the tight side
T2-initial tension on the slack side
m-coefficient of friction
u-angle from the point of tangency of T1 and T2 in radian
a-total angle of lap(90ofor flat belt/20o for vee belt) in degree
So,
T1/T2= emu/sin a
ln(T1/T2)=mu/sina
m=[ln(T1/T2)*sin a]/u
=[ln(50/49)*sin90o]/0.523599
=0.039
 |
Analysis and
Discussion:
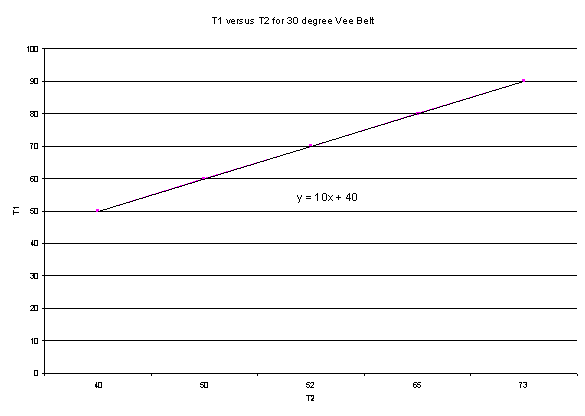
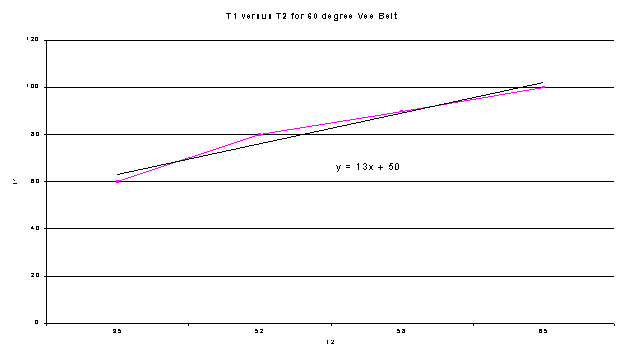
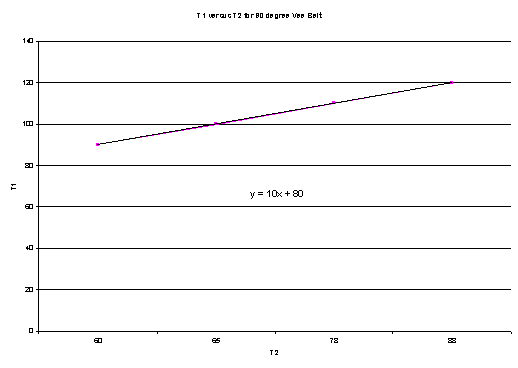
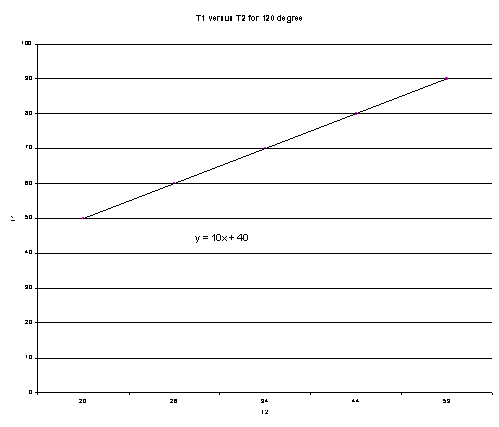
From the experiment done, the data collected can be analyzed by means of graph plotting. The graphs of T1 versus T2 for all peg and types of belt were plotted and the graph were found to be linear each having their own slope or gradient. The values of each friction coefficient for all set of T1-T2 were calculated and shown in the data table. Below are the average values of friction coefficient for the vee and flat belt:
|
|
For Flat belt |
For Vee belt |
|
Angled peg |
Coefficient of friction |
|
|
30 deg |
0.06475 |
0.1466 |
|
60 deg |
0.2738 |
0.146 |
|
90 deg |
0.1774 |
0.0786 |
|
120 deg |
0.1384 |
0.1178 |
|
150 deg |
0.1088 |
0.0818 |
The pulley was made of steel and from the ranges of coefficient of friction obtained, the value seems to fit the oak-tanned, canvas stitches and cootn woven type of belt material.
From all ten graphs plotted, the slopes were found to be similar, that is 10, for all angled pegs except for a couple of angled peg which may vary a little. From that, it can be deducted that the belt performed without the effect of elasticity since the value of T1 and T2 can be related with one another linearly from one angled peg to another. If the belt were to elongate, the slope obtained will be different for all angled pegs. The similarity in the slopes also suggest that that the force between T1 and T2 were balanced accordingly with the application of the pulley.
The coefficient of friction in this experiment may not be exactly correct and there are several reasons for this. One of them was that the spring balance might have been used so often that it has lost the accuracy. Another possible error was that the position of the belt which was not exactly aligned in the slot of the pulley and thus the force may not be transmitted properly.
Conclusion:
As a conclusion, we were able to determine the coefficient of friction between steel and the belt(Vee and Flat) by using the equation given in the sample calculation. The coefficient of friction for the Vee belt was found to be the highest at the angled peg of 30o with a value of 0.1466 and as for the Flat belt the highest was at angled peg of 60o with a value of 0.2738. Relatively, the flat belt has a higher coefficient of friction compared to the vee belt for all angled pegs except for the 30o where the Vee belt coefficient of friction is slightly higher than the flat belt.