Table Of Content:


Page number

Summary/Abstract:


Statement of Purpose/ Objective:


Theory:


Equipment/Description of Experimental Apparatus:


Procedure:


Data, Observation and Results:


Analysis and Discussion:


Conclusion:


References:


Summary/Abstract:


The first experiment was the linear conduction heat transfer along cylindrical metal rod. The specimen or materials used are aluminum, stainless steel and brass. From the Temperature versus Distance graph, the gradient was calculated for the range of distance 0.036-0.06m or 24mm in length. The heat transfer was one dimensional and it was governed by the Fourier’s Law. The heat input to the material was 10 Watt thus enabled us to calculated the thermal conductivity for each material using the gradient from the graph. The thermal conductivity, k, which supposed to be the same with the published value, was found having a error from 9.3-360%. This error might be due to the probe, which didn’t perform as expected thus the value of the temperature obtained was not correct. It was also proven that the heat transfer was improved when the area of the conduction process was increase and this was shown from the analysis of the aluminum cylinder with different radius.

The second experiment was done to study the radial conduction along circular  metal plate. The concept was still the same as with the linear conduction except that the heat distribution was in radial direction instead of linear. The temperature is high at the heat source and it was decreasing as it moved to the outermost layer of the radius.


Statement of Purpose/ Objective:


The objective of experiment 1 is to :-

·        Study the Fourier’s Law on linear and radial conduction heat transfer.

Theory:

The first experiment of linear conduction along cylindrical metal rod applied the Fourier’s Law, which states that the one-dimensional heat transfer in the x-direction per unit area perpendicular to the direction of transfer is proportional to the temperature gradient, dT/dx in this direction.


Q = kAdT/dx


Where k =thermal conductivity, W/m.K

A = area of heat transfer

dT/dx = temperature gradient


The second experiment is the radial conduction along circular metal plate. It still applies the Fourier’s law but instead of dealing with x, a linear heat transfer, it involves a radial displacement in a system which changed the Fourier’s equation for linear system altogether.


Qr = 2pLk(Ts1-Ts2)/ln (r2/ r1)


Where L= thickness of the hollow cylinder

            k = thermal conductivity of the material

Equipment/Description of Experimental Apparatus:

Basically, the two experiment used the equipment which are graphically shown below

Figure 1 The linear conduction
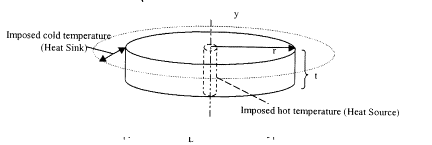

Figure 2 The radial conduction

Procedure:

Experiment 1: Linear Conduction Along Cylindrical Metal Rod

1.      The brass specimen was installed to the test unit.

2.      The probe was inserted in the holes provided along the specimen, while making sure that each one was touching the rod. The distance for each thermocouple (x values) was noted.

3.      The heater was turned on and the temperature after the readings reached steady value was recorded, which was about 30, to 45 minutes. The corresponding heater input was also recorded.

4.      The procedures 1 to 3 were repeated by using stainless steel and both aluminum (with different radius)


Experiment 2: Radial Conduction Along Circular Metal Plate.

1.      The thermocouples were inserted in the holes provided on the specimen, while making sure that each one was operating properly. The distance for each thermocouple  (r-values) was noted.

2.      The heater was turned on and the temperatures after the readings reached steady state,which was about 30 to 45 minutes was recorded. The corresponding heater input was also recorded.

Data, Observation and Results:

Experiment 1: Linear conduction along cylindrical metal rod.

Power input = 10 Watt


Temperature,oC

X(meters)

Aluminum

D = 0.02m

Aluminum

D = 0.025 m

Brass

D = 0.025m

Stainless Steel

D = 0.025m

T1

0

49.3

57.8

55.8

53.9

T2

0.0125

49.1

57.9

55.4

53.4

T3

0.024

46.9

52.7

49.7

48

T4

0.036

47.7

38.9

42.3

43.3

T5

0.048

47.1

36.4

41.7

42.9

T6

0.06

46.6

33.9

41

42.6

T7

0.032

34.3

32.0

34.2

34.9

T8

0.084

33.6

31.9

33.7

34.4


Experiment 2: Radial conduction along circular metal plate.

Power input = 20 Watt.


R(meter)

Temperature,oC

T1

0

50.7

T2

0.012

42.4

T3

0.024

39.0

T4

0.036

38

T5

0.048

37.7

T6

0.060

35.1

Analysis and Discussion:


1. For radial and linear conduction model, derive a general equation for the temperature reading as a function of distance, x for linear conduction and r, for radial conduction, using the parameters of k, t, Q, A, T1, L and R. State the boundary conditions applied.

For linear conduction:

Q = k A (dT/dx)

    = k A [(T2-T1)/(X2-X1)]


T2 = Q*(X2-X1)/k*A] + T1

For radial conduction:

Qr = 2ptk(Ts1-Ts2)/ln (R2/R1)

Ts2 = [Qr/2ptk]* ln (R2/R1)+Ts1

Boundary conditions: 

-         the cylinder is insulated, no heat out radially which made it a one-dimensional heat transfer

-         T1 is at x = 0

-         The temperature does not vary with time, steady state.


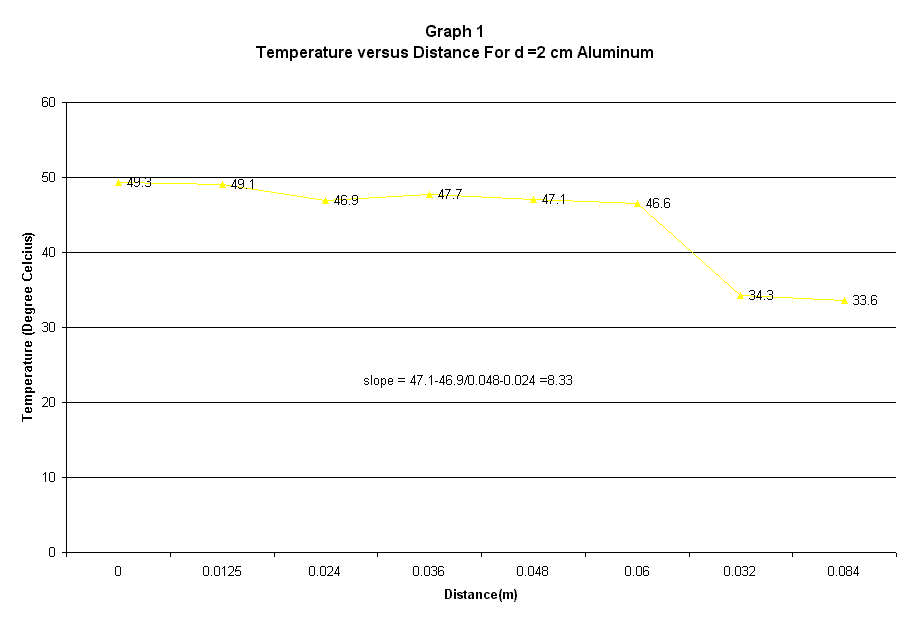
2. Plot the temperature profile for both models as a function of distance and obtain the slope dt/dx for linear conduction and dT/dr for radial conduction.


From Graph 1: slope = (44.8-44.1/0.036-0.06)= -29.17 oC/m


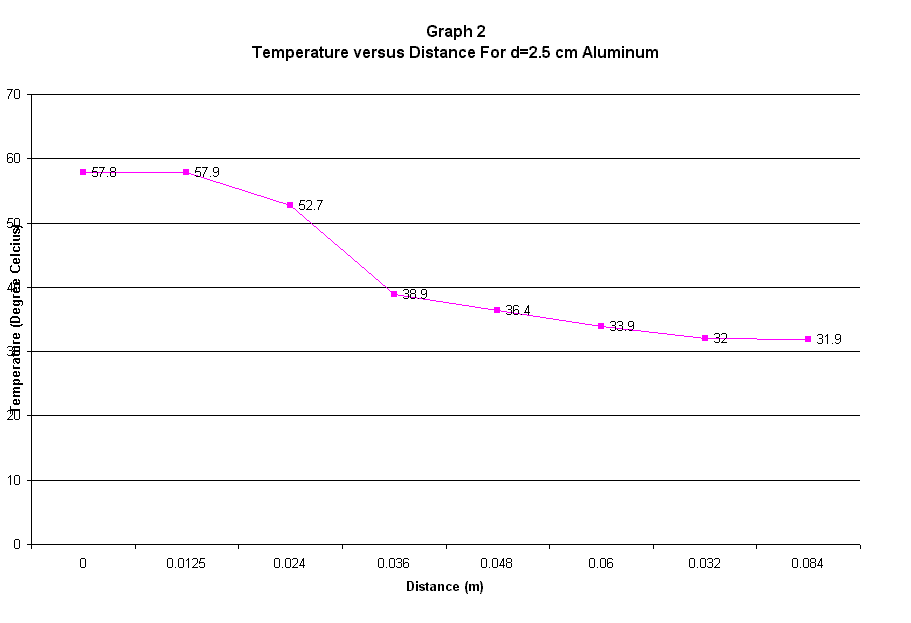
From Graph 2: slope = (38.9-33.9/0.036-0.06) = -208.33 oC/m


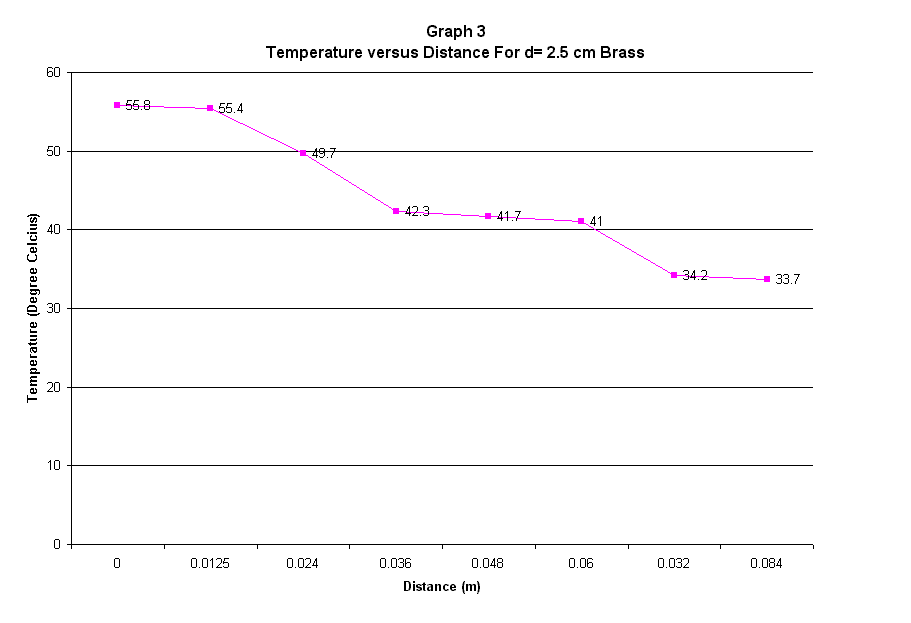
      From Graph 3: slope = (42.3-41/0.036-0.06)= -54.17 oC/m


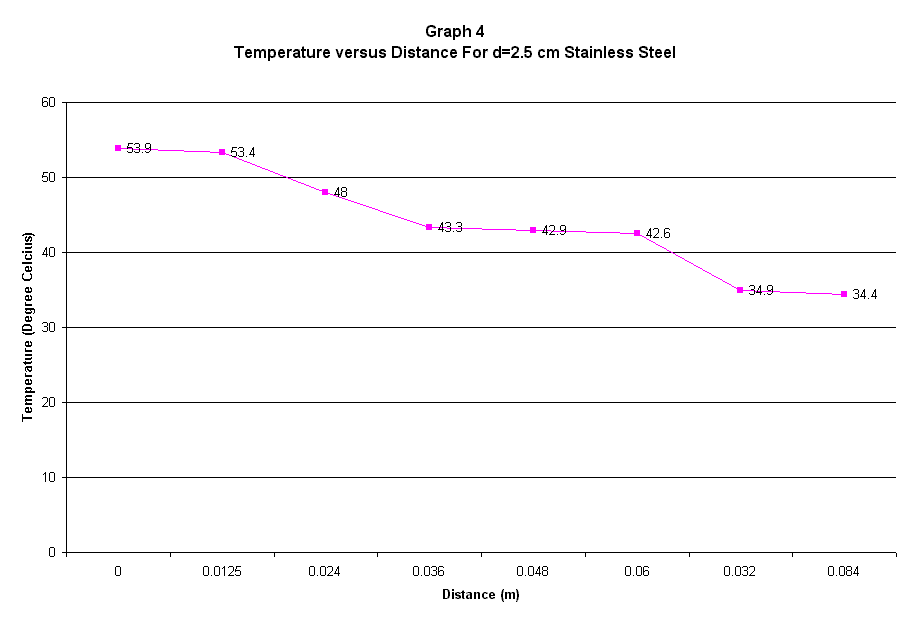
      From Graph 4: slope = (43.3-42.6/0.036-0.06)=-29.17 oC/m


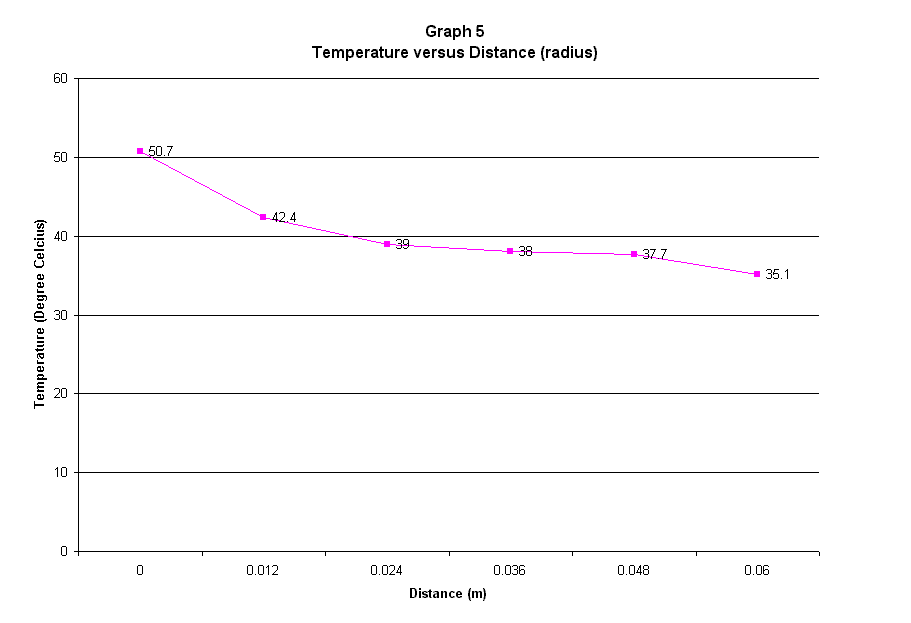
      From Graph 5: slope =(50.7-35.1/0.06) -260 oC/m


3.By using the slope of the graph plotted, calculate the thermal conductivity for each specimen used.


For linear conduction:


Power input : 10 Watt

A = p(d2/4)= p((0.02)2/4)=0.000314 m2

Graph 1: dT/dx = -29.17

              Q = kA(dT/dx)


               kAluminum = Q/(A*(dT/dx))

                  = 10/(0.000314)*( -29.17)

                  = 1092 W/m.K  


A = p(d2/4)= p((0.025)2/4)=0.000491 m2

Graph 2: dT/dx = = -208.33oC/m

              Q = kA(dT/dx)


               kAluminum = Q/(A*(dT/dx))

                  = 10/(0.000491)*(-208.33)

                  = 97.76 W/m.K  


A = p(d2/4)= p((0.025)2/4)= 0.000491 m2

Graph 3: dT/dx = -54.17 oC/m

              Q = kA(dT/dx)


               kBrass = Q/(A*(dT/dx))

                  = 10/(0.000491)*(-54.17 oC/m)

                  = 376 W/m.K  


A = p(d2/4)= p((0.025)2/4)= 0.000491 m2

Graph 4: dT/dx = -29.17

              Q = kA(dT/dx)

               ksteel = Q/(A*(dT/dx))

                  = 10/(0.000491)*(-29.17)

                  = 69.82 W/m.K  


A = p(d2/4)= p((0.02)2/4)=0.000314 m2

Graph 5: dT/dx = -260

Qr = 2ptk(Ts1-Ts2)/ln (R2/R1)


               k = [Q/(2pt(Ts1-Ts2)]*ln (R2/R1)

                  = [20/2*p*0.0032*(35.1-50.7)]*(ln 0.06)

                  = 179.4 W/m.K  


4.Compare and discuss the thermal conductivity obtained from the two methods and the typical values contained in tables of published data.


Specimen

Calculated k

Published k

Error %

Brass

376

110.00

241

Steel (AISI 1010)

69.82

63.90

9.3

Aluminum (D=25mm)

97.76

237.00

58.8

Aluminum (D=20mm)

1092

237.00

360


5.Compare and discuss the effect of changing the radius of the cylindrical rod for the

Aluminum specimen.


Theoretically, changing the radius means that the area is changed. Based on the Fourier’s equation, the heat transfer is proportional to the area of the material. Since the power input was set equal for both cases of aluminum radius of 2 cm and 2.5cm, the only parameter affected was the thermal conductivity calculated. Since there are variation in the temperature reading collected, the thermal conductivity for the material was found to be different which in this case should be the same.


Calculation of heat transfer for aluminum by using published k:


d = 2 cm

A = 0.000314 m2

Q = Ak (dT/dX)

    = 0.000314*237(29.17)

    =2.17 Watt


d= 2.5cm

A = 0.000491 m2

Q = Ak(dT/dX)

    = 0.000491*237*208.33

    = 24.2 Watt


From the calculation, it was found that the changing in the radius will increase the heat transfer for the material.


6.Discuss the characteristics of your plots and compare against the expected profile by the theory. Also discuss the validity of the Fourier’s Law and all the assumptions made as well as the error occurred if any.


The graphs show the same characteristic, which can be described in three sections. The first section of the graph is in the heater region ranging from 0-0.036m. The temperature gradient along these points is decreasing. The second section is in the material or specimen region ranging from 0.036-0.06m. This region is the vital part of all because it shows the behavior of the temperature across the surface of the material. The temperature gradient in this region is decreasing. The third section is in the cooling section ranging from 0.06-0.084m and as expected the temperature along these points also decreasing.  

From the calculated thermal conductivity, k, it was found that the error was so great that the Fourier’s Law was not found to be valid in this experiment. This may be due to some error which could not be avoided such as a malfunction in the probe that stops us from getting the correct temperature of the cylinder.


Conclusion

As a conclusion, it was found that the Fourier’s Law explained the behavior of the temperature in the linear and radial heat conduction. The temperature gradient in the linear heat transfer was found decreasing along the material from the hot surface end to the cold surface end. The heat transfer also depended on the area of the cylinder where the higher the area, the more the heat can be transferred. The radial heat transfer also exhibited the same results as the linear conduction. The temperature gradient of the brass was also found to decrease away from the heat source to the outer most radial displacement.

References:

1.      Incropera, Frank P. & DeWitt, David P., Fundamentals of Heat and Mass Transfer. Fourth Edition. John Wiley & Sons. 1996.

2.      Cengel, Yunus A. & Boles, Michael A., Thermodynamics: An Engineering Approach. Second Edition. McGraw Hill. 1989.